Solar farm, by maroke, Shutterstock
Antimony prices have been on a decline since their peak in June 2025. What’s driving this fall and what’s next for the market?
Antimony market prices are down 36% from the June 2025 peak, when they hit 6.65x the 2020 average.
The rally was fuelled by surging PV demand paired with sup-ply disruption and export controls from the largest global producer — China. While prices remain elevated, substitution and new supply are now exerting downward pressure on prices. Despite the current fall in antimony prices, the new average price will likely be different from historical average because of changes in the market fundamentals.
Since 2021, antimony prices had been slowly increasing because of a structural deficit in the market. This trend was amplified by Chinese export restrictions in 2025 that led to a sharp price rally to a near-term peak of $60,000 /t Sb in June, when antimony prices were 6.65 times higher than their 2020 average.
This price shock, along with genuine difficulty in material sourcing, forced buyers to look for thrift or find alternatives for antimony in their supply chain.
At the same time, the elevated price environment incentivised higher-cost marginal production to come online, estab-lishing a new (potentially temporary) price floor. As a result, antimony prices have remained higher than their historical average, despite retreating from their June 2025 peak.
Antimony market prices rallied as the market tightened
A structural deficit has characterised the antimony market since 2022, fuelled by two reinforcing dynamics:
• Demand: Antimony demand from photovoltaics (PV) was about 330% higher in 2024 than in 2020, reflecting strong growth in the photovoltaic (PV) market. Antimony trioxide is used in manufacturing of PV glass to reduce light absorption from iron (II) oxide in PV glass by converting it into iron (III) oxide. This increases the transmittance of the glass, thereby increasing the efficiency of the PV module — a key consideration for PV module buyers.
• Supply: In 2025, antimony supply from China was 24% lower than the production in 2021 due to a government crackdown on illegal mining from 2022 and a deterioration in ore grades. China plays a critical role in global anti-mony supply, as in 2025, it accounted for 61% of global production. Since a crackdown on illegal mining in 2022, Chinese output has struggled to return to historical lev-els. The resulting supply shock was further intensified in the USA, Europe and other markets outside China when Beijing introduced export restrictions on antimony.
Even in the absence of China’s export regulations, such large market disruptions caused by a demand surge and supply shock can trigger sharp price increases. This is especially true for minor metals, which are highly volatile and have low price elasticity because they contribute little to final product costs. A demand surge followed by decline in supply created a catalytic environment for antimony market prices to rise.
Antimony demand from PV

Trade restrictions imposed by China further amplified an already stressed market and helped drive the rally that culminated in June 2025.
Minor metal market inflation is real, but antimony overshot
Since early 2020, CRU’s basket of minor metals have increase driven by growth in new end uses related to the energy tran-sition and AI end uses, with more recent geopolitical tensions and trade barriers adding to the momentum. However, anti-mony prices outside China rose far more steeply compared to other minor metals after trade controls produced acute sup-ply shortages outside China.
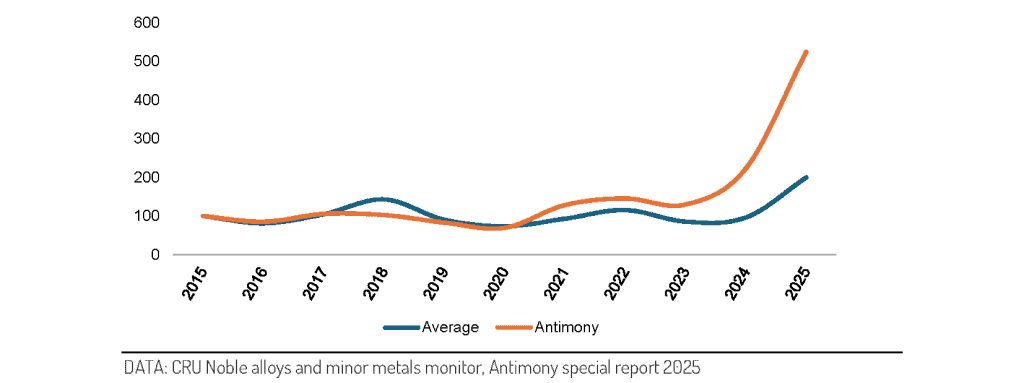
As noted earlier, three factors combined to trigger the antimony price rally: (a) falling supply, (b) a rapid surge in demand, and (c) export restrictions imposed by China. Together, these forces created the conditions for a sharp price spike.
Given antimony is a minor metal, it is associated with low price elasticity. This is because minor metals account for a small share of end-product costs, as a result price movements hardly prompt buyers to seek alternatives or adjust usage, amplifying market swings. The above chart compares how CRU’s minor metal price basket and antimony have behaved 2015 onwards.
Average minor metal and Sb 99.65%; methodology
Using a selection from CRU’s 850+ regular price assessments, we conducted a comparative analysis of antimony and related noble alloys. We normalised US ex. warehouse minor metal and noble alloys prices covered by CRU wherein 2015 = 100 and tracked relative evolution in their real values.
Methodology:
- We selected the US ex‑warehouse minor‑metal price series tracked by CRU and converted them to real terms by deflating with the GDP deflator.
- Each series was normalised to a base value of 2015 = 100, and changes were measured relative to that base.
We computed the cross‑metal average (arithmetic mean) of the selected minor‑metal series and compared that composite series to the antimony series
CRU’s minor metal price basket price trends: Prior to 2020, minor-metal prices generally hovered around 2015 average price, reflecting an absence of major structural shocks. That pattern started shifting 2020 onwards, largely driven by Chinese trade restrictions and growth in new end-use sec-tors. China is the dominant supplier of many minor metals, and after the country introduced export restrictions, prices for several minor metals rose sharply.
Antimony prices: Before 2021, antimony prices closely tracked the minor metal average and remained near historical norms. From 2021 onward, antimony prices began to diverge as the market tightened — this divergence accelerated in 2024-2025 when prices spiked further amid China’s export regulations.
While minor metal prices were above historical norms in 2025, antimony prices had clearly overshot its averages. That overshoot proved unsustainable — despite robust underlying fundamentals (tight supply and strong demand), the extreme price spike led to demand destruction and a subsequent fall in antimony prices.
Despite low price elasticity, the minor metals market is not immune to demand shocks
Minor metals are typically used in small quantities to enhance alloy properties and performance — some experts liken their role to the MSG of metals.
Advances in technology have made many of these metals essential to modern life. Subsequently, despite their relatively small market size, minor metals perform critical functions across many industries. A minor metal generally exhibits low price elasticity of demand as demand tends to remain stable through normal price cycles because these metals represent a small share of final product cost. Nonetheless, extreme price spikes can break the price rally through three primary channels:
- Demand destruction – end‑users reduce usage, postpone purchases or redesign products to lower exposure.
- Substitution – buyers actively qualify and adopt alternatives when price volatility and supply risk become intolerable.
- New supply – higher prices can prompt marginal producers to bring additional capacity online quickly.
A useful analogue is vanadium in 2018.
After a sharp price spike driven by a change in China’s rebar standards, steelmakers increasingly considered niobium as an alternative, despite vanadium being a relatively minor cost input. While niobium did not cause long‑term demand destruction for vanadium, the price shock was large enough to trigger active searches for substitutes, and new supply subsequently entered the market to help alleviate the shortage.
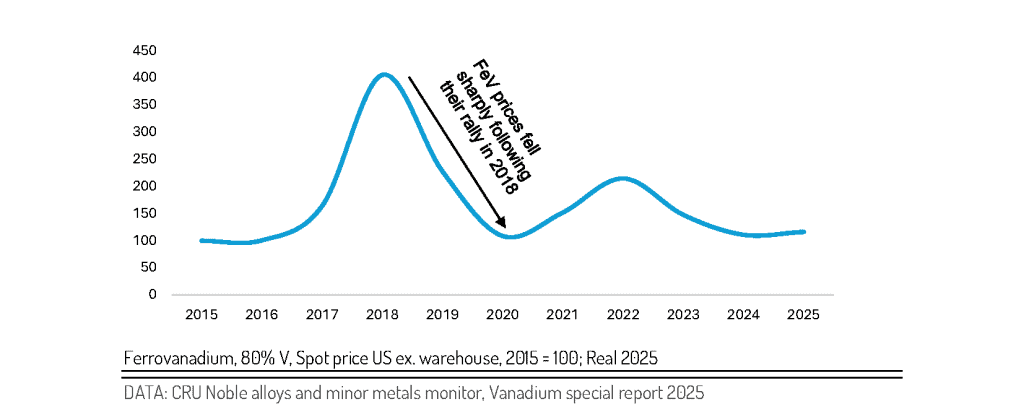
Unlike the vanadium rally, antimony’s price rise was driven by a new, sustained demand outlet and supply disruption. As a result, while vanadium largely returned to historical averages after its spike, it is far less clear that antimony will follow the same path given the structural change in the market.
Please note that though vanadium now has an emerging demand channel in vanadium redox flow batteries (VRFBs), this market has only become materially significant recently.
As antimony prices overshot, is price correction looming or will there be a new normal?
Antimony market prices surged by 76% in 2024 compared to the previous year. This momentum accelerated into 2025, with prices jumping another 47% between January and June alone. While the rally was driven by strong fundamentals, it ultimately overshot, similar to the 2018 price spike in the vanadium market.
This price spike prompted both demand substitution and new supply coming online in late 2025, mirroring the dynamics seen in the vanadium market. However, the antimony price rally was driven by three distinct and powerful factors:
- A surge in demand from a novel application
- A supply shock caused by closures of illegal mines
- Geopolitical tensions manifesting as export restrictions
This makes the antimony market outlook structurally different from the vanadium market. CRU examines the past and projected dynamics of the antimony market in much greater detail in our Antimony Special Report 2025.
Interest in critical minor metals is rising as China continues to protect strategic interests through trade restrictions, and as new end‑uses emerge driven by the energy transition and AI. CRU supports clients navigating these complex markets through price assessments, market reports, and bespoke consulting projects.
To learn more about our antimony report, please contact us
Piyush Goel, Consultant, CRU Group
Willis Thomas, Principal Consultant, CRU Group
Femi Odetunde, Senior Consultant, CRU Group